In April 2026, a solar farm selling into the French wholesale market earned about a tenth of the average price for the month, by commodity analytics firm Kpler’s count. On the other side of the world, in the last quarter of 2025, South Australia’s daytime power prices were zero or negative in 88% of five-minute intervals, according to the Australian Energy Market Operator. California’s grid operator curtailed 3.4 TWh of wind and solar output in 2024, 29% more than the year before, and 93% of it was solar. Spain cleared 397 hours of negative prices in the first quarter of 2026, compared with 48 a year earlier.
The markets, regulators and weather are different in each case, but the mechanism is the same. Wherever wind and solar reach a large share of supply, they depress the prices they earn, output that no longer pays gets switched off, and the gap between the average market price and what a renewable asset actually captures keeps widening. Hedges designed for flatter markets were never built to handle that gap.
That is why the old way of thinking about renewable finance has stopped being useful. For years the debate was mostly binary: sign a long-term contract or stay merchant. Structuring desks now treat it as a design problem with three goals that pull against each other: protect expected revenue, cap the downside in cash flow, and get the cheapest capital the risk profile allows. Much of the detailed data below comes from Europe, where regulation is changing fastest, but the logic applies wherever renewables have started to set the price.
Revenue risk is not one risk
A renewable asset’s revenue in any hour is price multiplied by volume. That simple product hides several separate exposures, and most structuring mistakes come from treating two or three of them as one.
- Price level: where the forward curve settles over the contract’s life.
- Shape: the gap between the baseload price and what the asset’s own production profile earns. In Germany in 2025, the average spot price was €89.32/MWh but solar earned only €45.08/MWh. Onshore wind earned 83% of baseload and offshore wind 90%.
- Volume: how much the asset produces, driven mainly by weather.
- Covariance: the tendency for volume and price to move against each other.
- Basis: the difference between the hub price a hedge settles on and the price at the asset’s own node or zone.
- Negative-price exposure: what happens contractually and physically when the price drops below zero.
- Operational: availability, degradation and outages at the asset itself.
- Counterparty: whether the other side of the hedge pays when it is out of the money.
Every hedge instrument is a bundle of some of these risks. The useful question is always which ones it moves, and to whom.
A market and a rulebook moving in the same direction
Negative prices are spreading geographically as well as in depth. By consultancy Ricardo’s count, EU-27 day-ahead markets cleared 1,223 hours below zero in the first quarter of 2026, more than double the 593 a year earlier. In Germany in April 2026, 47% of all solar output was generated in hours when the price was negative. Operators have responded by switching off earlier: Germany’s price-driven curtailment rose 20% in the first half of 2026, to 1,463 GWh, even though the number of negative-price hours fell.
The damage is not spread evenly, even between neighbouring markets. Kpler put Europe’s average solar capture rate in spring 2026 at 38%, with Great Britain and northern Italy holding up best and Iberia near the bottom. That makes it risky to take a hedge structure that works in one market and use it unchanged in another.
Policy is now reshaping the risk that private hedges have to cover. Since early 2025, new German plants receive no support payment during negative-price periods, and the same law freed co-located batteries to trade in the market. From 17 July 2027, EU state support for new wind, solar and nuclear must take the form of two-way contracts for difference. Economically, a CfD is a swap with the state, not a collar. The European Commission’s guidance favours production-independent designs, which pay on capacity or a reference plant rather than actual output, and says no aid should be paid for production when its market value is negative.
For a desk, that kind of CfD hedges price level against a reference profile and little else. Volume, shape relative to the reference, negative-price exposure and basis all stay with the generator. The guidance also lets generators bid only part of their capacity into a CfD and sell the rest under PPAs. Stacks of CfD, PPA and merchant exposure on a single asset are going to become normal, and each layer needs its risk mapped separately.
What each instrument actually moves
| Instrument | Price level | Shape | Volume | Covariance | Basis | Operational |
|---|---|---|---|---|---|---|
| Fixed-volume swap | Removed | Kept | Kept | Kept (amplified) | Kept | Kept |
| Baseload PPA | Removed | Kept | Kept | Kept | Kept | Kept |
| Pay-as-produced PPA | Removed | Removed | Removed | Removed | Depends on settlement point | Kept |
| Proxy revenue swap | Removed | Removed | Removed | Removed | Kept | Kept |
| Weather derivative | Kept | Kept | Removed (parametric) | Partly | Kept | Kept |
| Stack-and-roll | Partly (front years) | Kept | Kept | Kept | Kept | Kept |
| Production-independent 2w-CfD | Removed vs reference | Kept vs reference | Kept | Kept | Kept | Kept |
| BESS toll or FPA | Removed | n/a | n/a | n/a | Moved to offtaker | Kept |
Fixed-volume swaps remove price-level risk only. They suit flat-producing assets and are dangerous for weather-dependent ones because of covariance: if output falls short in an hour when prices spike, the generator must buy the missing power at the spot price. Texas in February 2021 is the standard warning, when some wind projects with fixed-shape hedges took losses that threatened their solvency. Insurers now write balance-of-hedge cover for projects and volume firming agreements for corporate buyers, which turn that covariance risk into a known premium.
Pay-as-produced versus baseload PPAs decide who carries shape, volume and covariance, and the gap between them is now large. In its June 2025 outlook for 2026–2035, consultancy KYOS put Spain’s baseload price at €59.9/MWh against a solar capture price of €33.6/MWh, before a further 20% discount it expects sellers to accept for long-term deals. How a PPA treats negative-price hours matters almost as much: Pexapark found that in 2024 up to 23% of a typical German solar asset’s output fell into zero- or negative-priced hours. A zero floor, a right to curtail or compensation for deemed generation can each decide whether the PPA works as a hedge.
Proxy revenue swaps move price, shape, volume and covariance to the hedge provider, which pays a fixed sum in exchange for the output the asset should have produced given measured wind or irradiance. Operational and basis risk stay with the project, which is exactly why lenders like the structure. Enel Green Power’s 2019 swap on 295 MW of its High Lonesome wind farm in Texas, backed by Allianz and Nephila, is the usual reference deal.
Weather derivatives hedge volume alone. When Europe had its weakest spring winds in decades in 2025, Bloomberg reported that German wind output fell 30% year on year in the first quarter, and utilities including Iberdrola, RWE and Vattenfall turned to parametric cover from insurers such as Munich Re and Swiss Re.
Stack-and-roll deals with tenor rather than shape. Because forward liquidity fades after two or three years, a desk sells long-dated volume in the front years and rolls it forward. The imperfect link between front and back years, plus repeated bid-ask costs, is what an offtaker charges as the liquidity premium.
Solar: the hedge is becoming a storage decision
Solar’s problem is no longer volume, because irradiance is predictable. The problem is shape, and it gets worse as each new gigawatt of panels pushes midday prices further down. A 50% capture rate means half a baseload-referenced hedge’s value can disappear in the gap between the reference and what the asset actually earns.
The market’s answer is increasingly physical. LevelTen Energy’s second-quarter 2026 data shows hybrid solar-plus-storage PPAs priced 24% above solar-only PPAs but still 15% below wind, and hybrids were the most common deal type in eight European markets. LevelTen estimates that adding storage can raise a German solar project’s captured value by up to 80%. With a few hours of storage, a solar asset can shift output out of the hours when it is worth least and offer a shaped or near-baseload product. The battery becomes the hedge for shape, and the financial contract hedges the shifted profile.
Solar’s data also goes stale quickly. A capture-rate model calibrated on 2022–2024 describes a market with far fewer panels and batteries than the one a new contract will settle in. Any fixed-price solar PPA beyond ten years is, in effect, a bet on how fast the midday discount widens, or is closed again by storage.
Wind: the risk that futures can’t touch
Wind looks healthier on capture rates, but that masks a harder problem. Its output is lumpy, has no reliable daily pattern, and can collapse across a whole region for weeks, as spring 2025 showed. Volume and covariance, not shape, are what hurt wind projects, which is why proxy swaps and weather cover were developed for wind first.
Academic work points the same way. In a July 2026 paper, Konstantinos Chatziandreou and Sven Karbach of the University of Amsterdam propose a two-layer hedge in which “liquid futures hedge traded price risk dynamically, while a fixed portfolio of renewable-linked claims targets residual volume and covariance risk.” Futures, however cleverly rolled, only reach the price layer.
Wind does have one advantage over solar: output in different regions correlates far less than midday solar does. A wind portfolio spread across several countries can leave more volume risk unhedged than a single asset could, while still buying protection against a continent-wide lull.
Storage: when there is nothing to hedge
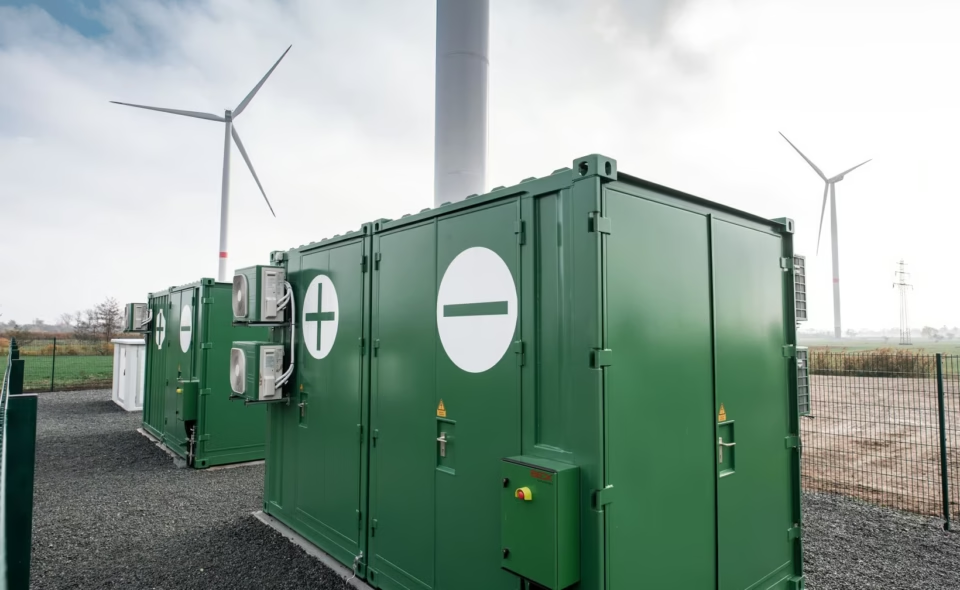
Many standalone batteries have no generation contract to hedge, so the decision to toll or not is effectively the whole financing decision. Modo Energy counted 82 European BESS financings worth €8.6 billion in 2025, up from 25 the year before, with standalone tolling agreements rising from three to 15.
Whether a toll helps depends heavily on its price. Modo’s analysis of the German market found that below about €95k/MW a year, fixing more revenue lowers equity returns. Between €100k and €110k, more tolling unlocks more debt and returns rise. Above about €115k, returns flatten beyond 80–90% tolled because the project can’t carry more debt. German deals cluster at 80–100% tolled, over five to ten years.
The catch is what a toll leaves behind. It removes market-price risk, but availability, degradation and round-trip efficiency usually stay with the owner. A term sheet can look 100% hedged while the risk lenders care most about in operation is still with the sponsor. For merchant batteries, stacking revenue across arbitrage, balancing and capacity payments is the nearest thing to a portfolio hedge.
Where the cost of capital is actually decided
Every hedge also swaps market risk for counterparty risk. A generator’s exposure to its PPA buyer is largest when market prices fall well below the strike, which is exactly when it depends most on being paid. Public backstops such as the European Investment Bank’s €500 million PPA guarantee, approved in June 2025, help smaller buyers sign contracts. But as University of Bologna researchers Nicola Bartolini, Silvia Romagnoli and Amia Santini put it in a July 2026 paper, “guarantee schemes do not eliminate risk but rather transfer it.” A higher strike from a weaker buyer can be worth less than a lower one from a stronger buyer.
That is the lens lenders use. Their credit models spend little time on the hedge ratio on the front of the term sheet and ask which risks have actually left the project. A solar farm with a fixed-volume swap and no storage may be 70% hedged on paper while carrying most of the shape and negative-price risk. A wind farm with a pay-as-produced PPA has moved volume risk but concentrated counterparty risk. A tolled battery is fully price-hedged and still fully exposed to its own availability. None of these is a bad structure. Each leaves a risk behind that has to be named, sized and either kept on purpose or covered with a second instrument.
The desks that get the best terms can go through that list with the lender one risk at a time. The hedge ratio measures how much of the revenue is contracted. What lenders actually price is where each risk now sits.
Join us at 4th annual Power & Money conference in Amsterdam: